The dashboard is the first screen you see after signing in. It answers one question quickly: how is my spending going? Here is what each part is for and how to get more from it.
Choose the period first
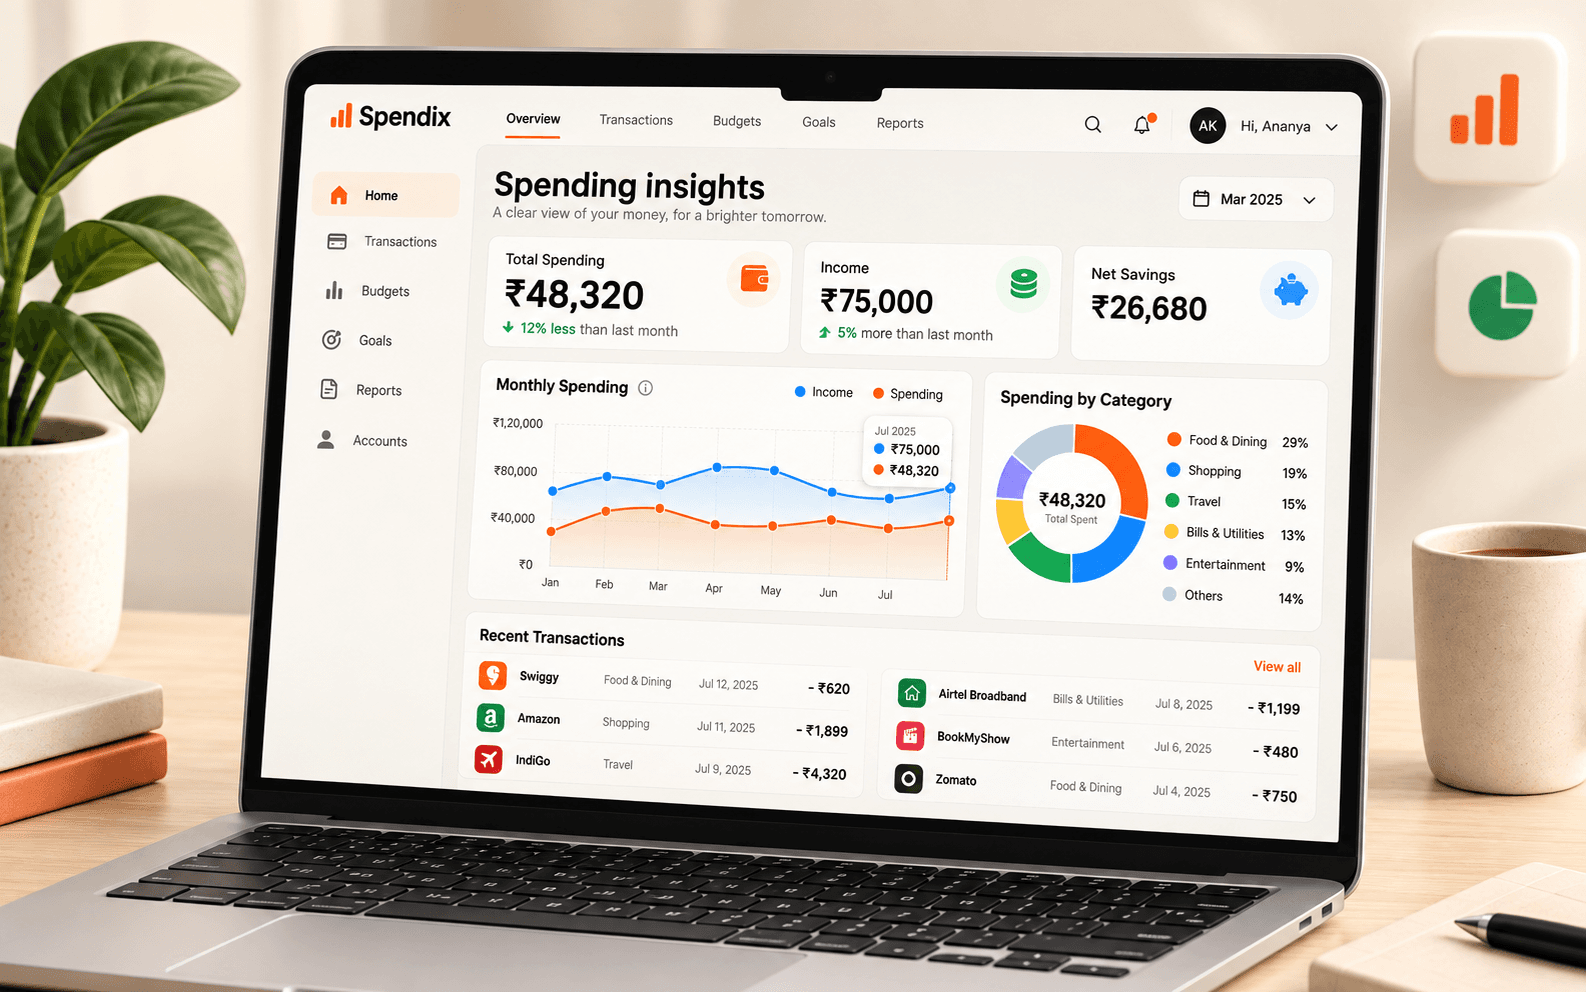
Everything on the dashboard follows the period selector at the top: this month, last month, the last three months, or a custom range. Switching from this month to last month is the fastest way to see whether a total is normal, because a full month is a fairer comparison than a half month.
The headline figures
The tiles at the top summarise the period:
- Total spend, with how it changed against the previous period.
- Business spend and personal spend, so you can see the split.
- Transaction count, average transaction and largest transaction.
- Uncategorised count: how many transactions still need a category.
- Active subscriptions: recurring charges currently in play.
Treat them as the starting point. If a number looks off, the sections below show what sits behind it.
Spend trend
The trend chart plots your spending over time and compares it with the previous period. Look for the shape rather than the exact figures: steady, rising, or a few tall spikes. A spike usually means one large purchase or a bill landing early, and it is worth a click.
Top categories and top merchants
- Top categories show what kind of spending dominates, such as rent, food or travel.
- Top merchants show where the money actually went, which can surprise you. A small merchant you visit daily can outrank a large one-off.
If a category looks too big, open Transactions filtered to that category and read the list. Mistakes and miscategorised items show up quickly this way.
Recent activity
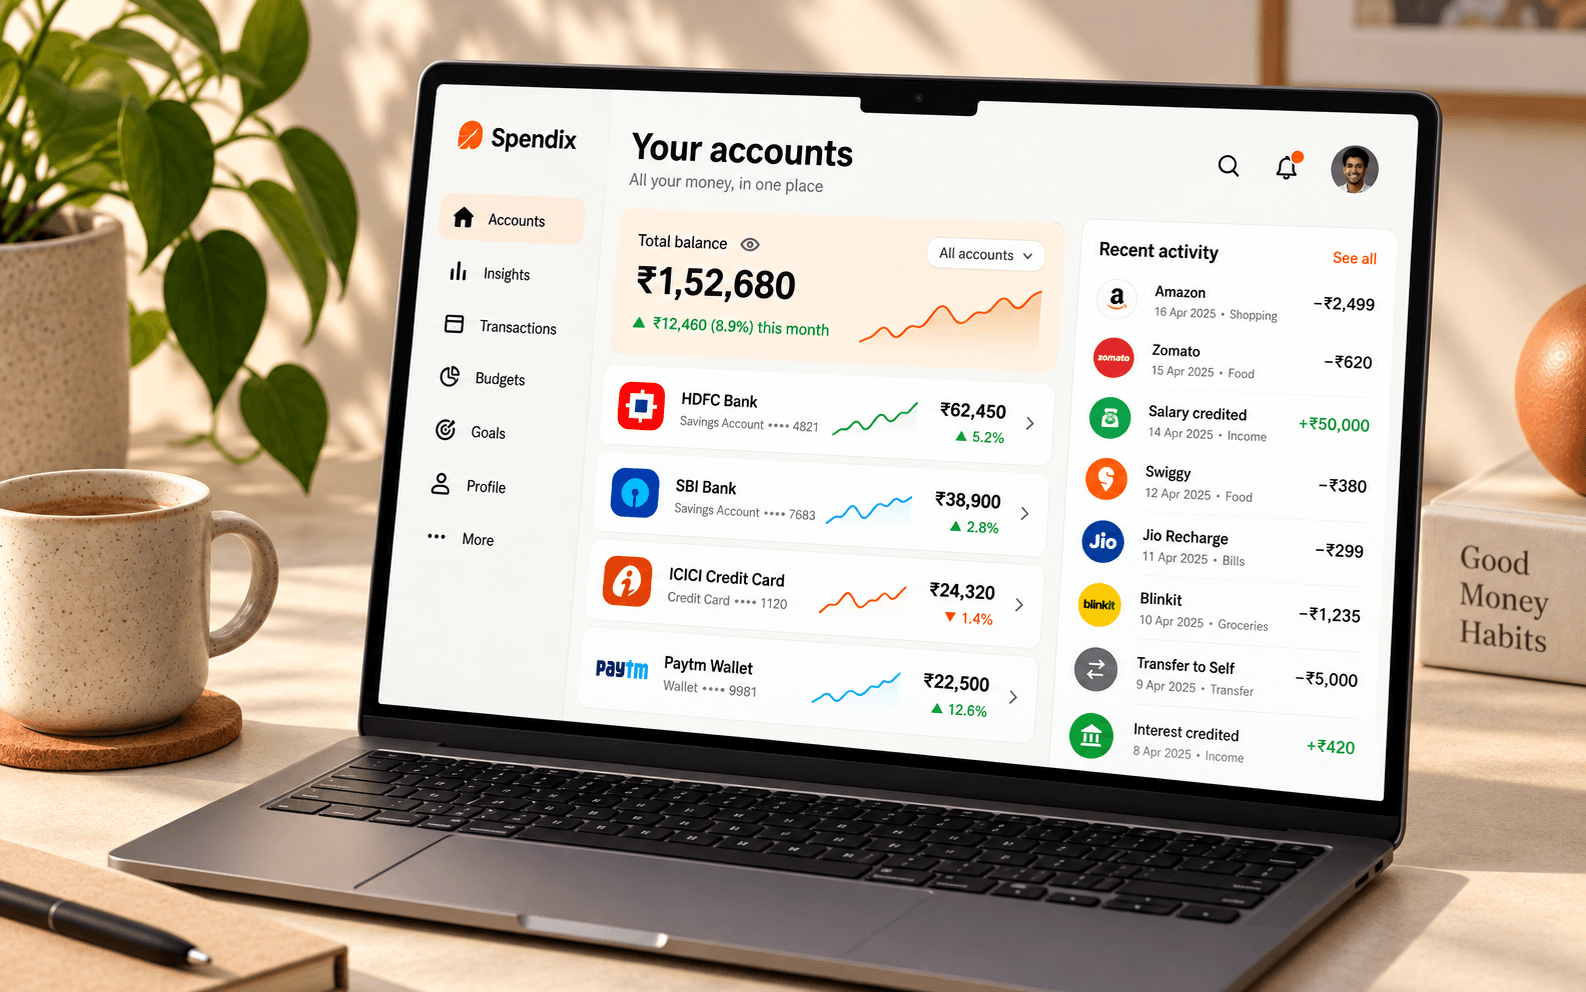
Recent activity lists your latest transactions, so you can confirm that a new import or entry landed correctly without leaving the dashboard.
Things that need your attention
The dashboard also flags work waiting for you, such as uncategorised transactions, possible duplicates and imports ready for review. Each one links to the matching list, so clearing them takes a few clicks.
A two-minute weekly habit
- Open the dashboard for this month.
- Check the trend and the top category.
- Open one transaction you do not recognise.
- Fix any category that looks wrong, so your history stays accurate.
Know where your money goes.
See income, expenses, categories, and changes over time in one clear view.