Read the trend
Compare spending across days or months and see when it changed.
See income, expenses, categories, and changes over time in one clear view.
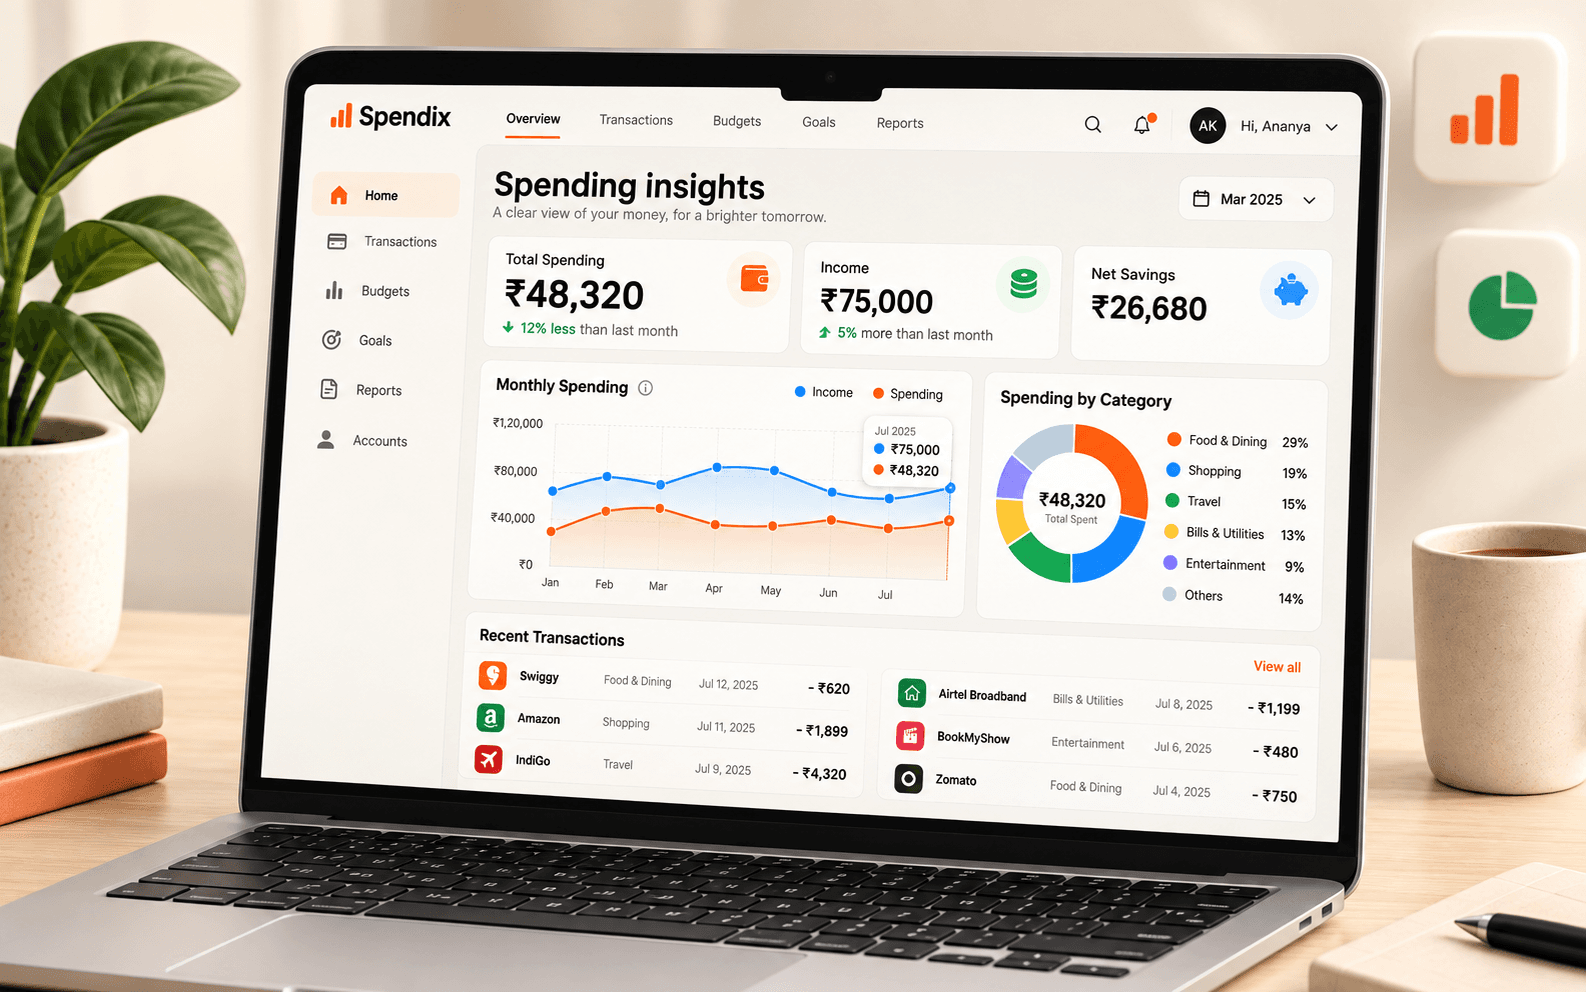
A single total rarely tells you enough. SpendixAI puts the trend, the categories, and the transactions behind it in the same place.
Compare spending across days or months and see when it changed.
Move from a total into categories and the underlying transactions.
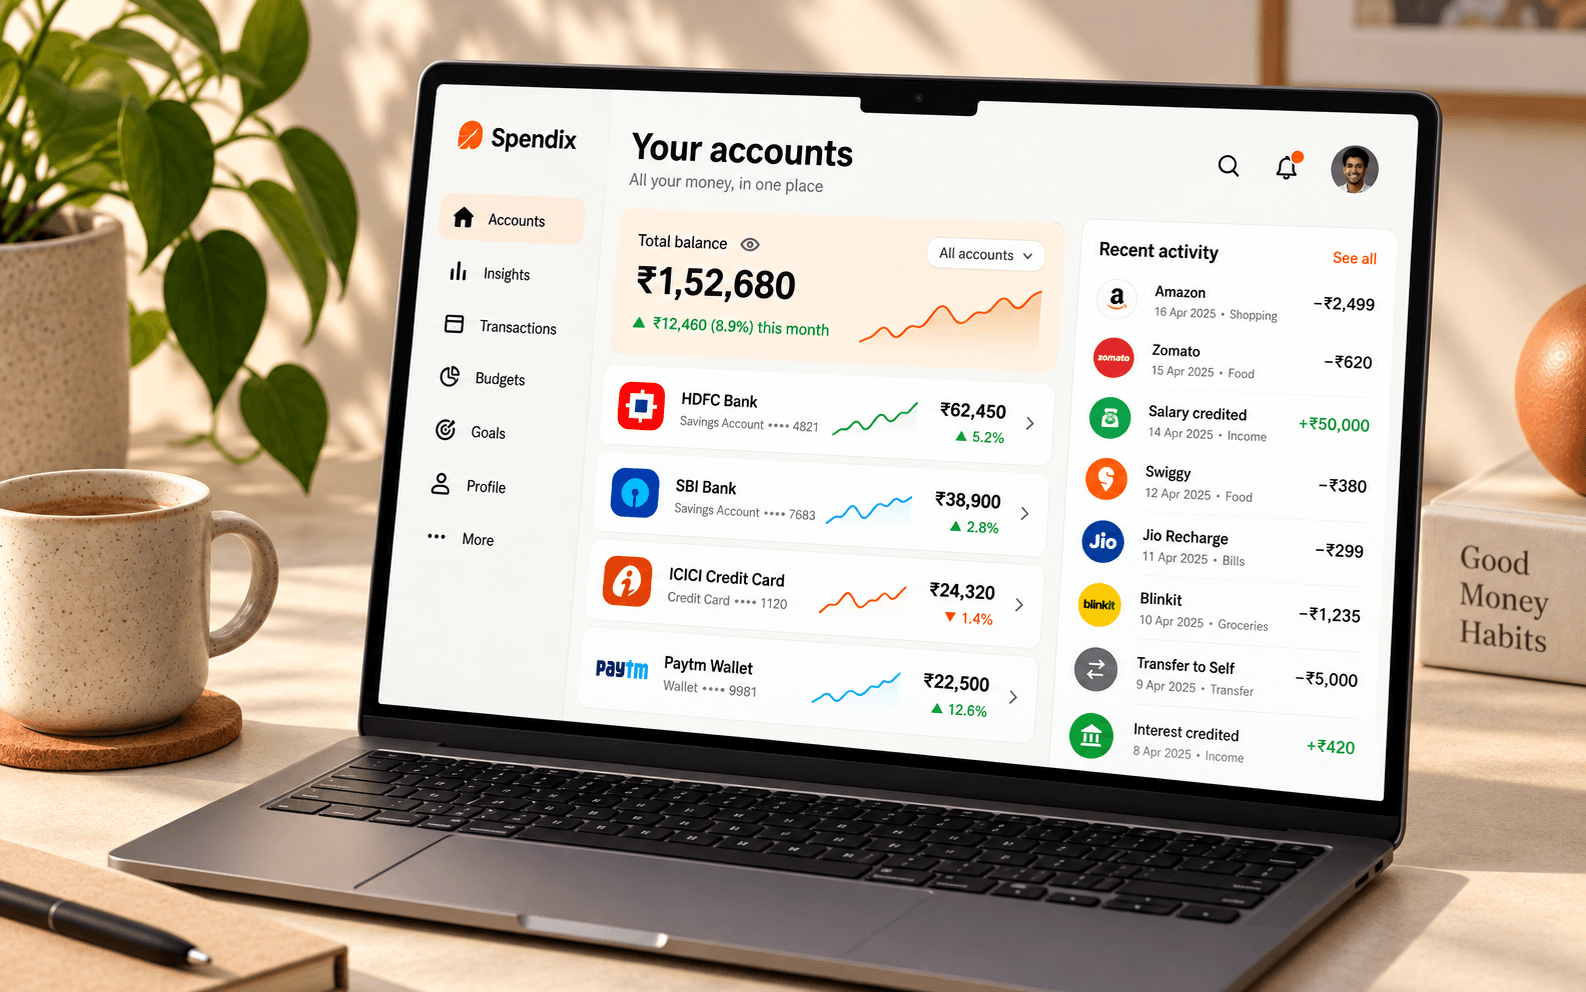
See income, expenses, and account activity together.
See a rise in dining spend, then open the category to understand the purchases behind it.
Add transactions or import a statement to build your history.
Review how expenses are grouped and correct anything that needs attention.
Use the dashboard and insights to compare periods and spot changes.
illustrative monthly spend
Explore the full picture with your own data after you sign in.
Create your accountSee how this feature fits into your SpendixAI workspace.
Yes. Once you add or import transactions, your dashboard and insights reflect your workspace data.
You can review different time periods to understand how your spending changed.